Silicon Valley Bank in the US has collapsed. SVB imploded as 3 risks collided
- Side effects of excessive money printing came to the fore –> steep increase in the US yield curve as long term interest rates rose from 1.5% to >5% in about 15 months
- Highly concentrated depositor base which withdrew large sums quickly
- Huge Asset Liability mismatch –> short term deposits were parked in long term Assets (akin to what happened with our Real Estate NBFCs). Hence, SKB was forced to sell long term assets and book losses when faced with withdrawals at the wrong time, which eroded its Capital base and created momentum for a run on deposits (vicious cycle).
An article that explained what happened is enclosed.
This is a good time to revisit why we never go down the risk curve in Financials.
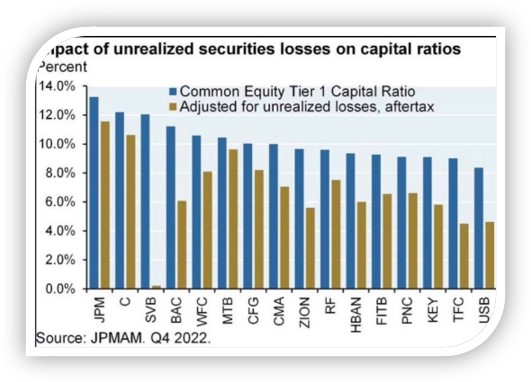
The chart below shows “the discipline” with which various Banks in the US are being run, ie, the impact on the Capital Adequacy of each bank due to mark to market on losses due to rise in interest rates (pls read attached pdf). However, the more risk you took, the higher the interest spread would have boosted profit short term. SVB stands out on the risk it was sitting on vs other Banks.

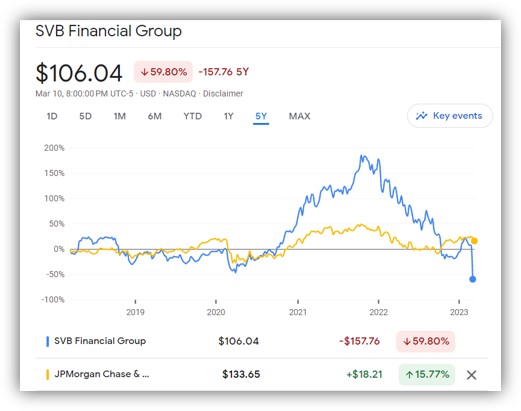
The chart below is the stock price of SVB vs JP Morgan over the last 5 years. SVB outperformed JP Morgan significantly as it took on more risk when the US Govt gave its Covid stimulus. Bankruptcy happened “gradually, then suddenly”

This is a good time to remind our partners
- Why “resilience > speed” is always the North star of our approach
- Why we never go down the quality curve in Financials to play cheap valuations (why no PSU Banks or NBFCs in the portfolio)